OpenK Research
Uncertainty has shape.
OpenK seeks to provide broader context for equity decisions. It reads decades of price behavior to find where fear and liquidity have stretched expectations past what the economy can deliver, and where that gap becomes opportunity.
The investment problem
Which information permanently changes the future, and which only temporarily changes the market's interpretation of it?
The K curve
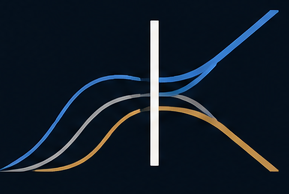
Markets fluctuate around an evolving long-run structure. Short-term information can pull price far from that structure, while the structure itself changes gradually over time. That reference is not a fixed average or a target price. It shifts as the market and the economy evolve.
The K curve is OpenK's model of that moving reference, adapted from a published and well-tested idea and now in live testing. Reversion does not mean returning to an old price. It means the temporary part of a move has more room to fade as the horizon grows.
Anticipation vs Realized Outcomes
Uncertainty has consequences, and the market prices them consistently
On any date, the options market implies a full distribution of where the index could go. These are real market-implied distributions on historical dates, recovered from option prices, compared to the outcome that arrived. The distance between the priced fear and the realized result is the gap OpenK studies.
Real market-implied distributions recovered from option prices (curated, downsampled, and rounded), with realized index returns. The shaded region is the probability the market assigned to an outcome at or below what happened. These are selected illustrative episodes, not a sample of all periods, and are not indicative of any trading result or future outcome.
Look a year out and a pattern appears: on four of these five dates, the center of the distribution sat below the outcome that arrived. The exception, the top before the 2022 bear market, is a reminder that it is a tendency, not a rule. Whether that gap is systematic, and whether it can be turned into anything reliable, is exactly the question we want to answer.
The economic-cycle feedback loop
Markets respond to the cycle, and help create it
The ideas behind the research
The framework the research is built on
How we believe markets behave, and why the shape of uncertainty is the thing worth forecasting.
Research implementation
How my intuition became a model.
OpenK began as an attempt to show a computer what I was seeing, starting from price history.
Elastic field
Where the market sits relative to many historical scales.
Path field
How the market arrived at its current state.
Forward distributions
A physical estimate of the range of future outcomes.
Market-Implied distributions
The distribution the options market is pricing.
Comparison research
Where the two views disagree, and what that may mean.
Every result must beat an honest baseline before it is shown
Results are validated chronologically, against real baselines, with controls for leakage and hindsight. Work that only looks good because of a subtle error does not survive, and the failures stay on the record. That discipline is the difference between a real finding and a lucky backtest.
Where the work stands. OpenK is a research program in live testing, not a signal service or a fund. The distribution visuals on this page are illustrative; the models, parameters, and current outputs stay private.
Follow the research
Get the research notes as they publish
New findings and essays, sent when they are ready. No noise, no sales, and no obligation to do anything but read.
Work with the research
Three ways in
OpenK offers no advisory services and takes no clients or compensation for investment advice. A methodology walkthrough is a non-advisory research discussion.
Request a methodology walkthrough
A private walk through how OpenK builds and validates its distributions.
Researchers & quantsPropose a falsification test
Bring a way to break the framework. The result, pass or fail, goes on the record.
EveryoneGet the research notes
New findings and essays as they publish. No noise, no sales.
OpenK Research is led by Max Krehbiel. About OpenK and the founder.